Kibana4 可视化插件开发
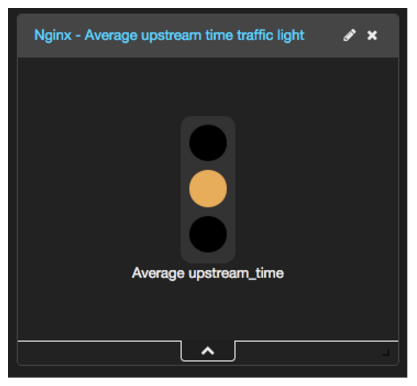
上一节,我们看到了一个完整的 Kibana 插件的官方用例。一般来说,我们不太会需要自己从头到尾写一个 angular app 出来。最常见的情况,应该是在 Kibana 功能的基础上做一定的二次开发和扩展。其中,可视化效果应该是重中之重。本节,以一个红绿灯效果,演示如何开发一个 Kibana 可视化插件。

插件目录生成
Kibana 开发组提供了一个简单的工具,辅助我们生成一个 Kibana 插件的目录结构:
npm install -g yo
npm install -g generator-kibana-plugin
mkdir traffic_light_vis
cd traffic_light_vis
yo kibana-plugin
但是这个是针对完整的 app 扩展的,很多目录对于可视化插件来说,并没有用。所以,我们可以自己手动创建目录:
mkdir -p traffic_light_vis/public
cd traffic_light_vis
touch index.js package.json
cd public
touch traffic_light_vis.html traffic_light_vis.js traffic_light_vis.less traffic_light_vis_controller.js traffic_light_vis_params.html
其中 index.js 内容如下:
'use strict';
module.exports = function (kibana) {
    return new kibana.Plugin({
        uiExports: {
            visTypes: ['plugins/traffic_light_vis/traffic_light_vis']
        }
    });
};
package.json 内容如下:
{
    "name": "traffic_light_vis",
    "version": "0.1.0",
    "description": "An awesome Kibana plugin for red/yellow/green status visualize"
}
这两个基础文件格式都比较固定,除了改个名就基本 OK 了。
然后我们看最关键的可视化对象定义 public/traffic_light_vis.js 内容:
define(function (require) {
  // 加载样式表
  require('plugins/traffic_light_vis/traffic_light_vis.less');
  // 加载控制器程序
  require('plugins/traffic_light_vis/traffic_light_vis_controller');
  // 注册到 vis_types
  require('ui/registry/vis_types').register(TrafficLightVisProvider);

  function TrafficLightVisProvider(Private) {
    // TemplateVisType 基类,适用于基础的 metric 和数据表格式的可视化定义。实际上,Kibana4 的 metric_vis 和 table_vis 就继承自这个,
    // Kibana4 还有另一个基类叫 VisLibVisType,其他使用 D3.js 做可视化的,继承这个。
    var TemplateVisType = Private(require('ui/template_vis_type/TemplateVisType'));
    var Schemas = Private(require('ui/Vis/Schemas'));

    // 模板化的 visType 对象定义,用来配置和展示
    return new TemplateVisType({
      name: 'traffic_light',
      // 显示在 visualize 选择列表里的名称,描述,小图标
      title: 'Traffic Light',
      description: 'Great for one-glance status readings, the traffic light visualization expresses in green / yellow / red the position of a single value in relation to low and high thresholds.',
      icon: 'fa-car',
      // 可视化效果模板页面
      template: require('plugins/traffic_light_vis/traffic_light_vis.html'),
      params: {
        defaults: {
          fontSize: 60
        },
        // 编辑参数的页面
        editor: require('plugins/traffic_light_vis/traffic_light_vis_params.html')
      },
      // 在编辑页面上可以选择的 aggregation 类型。
      schemas: new Schemas([
        {
          group: 'metrics',
          name: 'metric',
          title: 'Metric',
          min: 1,
          defaults: [
            { type: 'count', schema: 'metric' }
          ]
        }
      ])
    });
  }

  // export the provider so that the visType can be required with Private()
  return TrafficLightVisProvider;
});
然后就是可视化效果的模板页面了,traffic_light_vis.html 毫无疑问也是一个 angular 风格的:
<div ng-controller="TrafficLightVisController" class="traffic-light-vis">
    <div class="metric-container" ng-repeat="metric in metrics">
        <div class="traffic-light-container" ng-style="{'width': vis.params.width+'px', 'height': (2.68 * vis.params.width)+'px' }">
            <div class="traffic-light">
                <div class="light red" ng-class="{'on': (!vis.params.invertScale && metric.value <= vis.params.redThreshold) || (vis.params.invertScale && metric.value >= vis.params.redThreshold) }"></div>
                <div class="light yellow" ng-class="{'on': (!vis.params.invertScale && metric.value > vis.params.redThreshold && metric.value < vis.params.greenThreshold) || (vis.params.invertScale && metric.value < vis.params.redThreshold && metric.value > vis.params.greenThreshold) }"></div>
                <div class="light green" ng-class="{'on': (!vis.params.invertScale && metric.value >= vis.params.greenThreshold) || (vis.params.invertScale && metric.value <= vis.params.greenThreshold) }"></div>
            </div>
        </div>
        <div>{{metric.label}}</div>
    </div>
</div>
这里可以看到:
- 把 div 绑定到了
TrafficLightVisController控制器上,这个也是之前在 js 里已经加载过的。 - 通过
ng-repeat循环展示不同的 metric,也就是说模板渲染的时候,收到的是一个metrics数组。这个来源当然是在控制器里。 - 然后具体的数据判断,即什么灯亮什么灯灭,通过了
vis.params.*的运算判断。这些变量当然是在编辑页面里设置的。
所以下一步看编辑页面 traffic_light_vis_params.html:
<div class="form-group">
  <label>Traffic light width - {{ vis.params.width }}px</label>
  <input type="range" ng-model="vis.params.width" class="form-control" min="30" max="120"/>
</div>
<div class="form-group">
  <label>Red threshold <span ng-bind-template="({{!vis.params.invertScale ? 'below':'above'}} this value will be red)"></span></label>
  <input type="number" ng-model="vis.params.redThreshold" class="form-control"/>
</div>
<div class="form-group">
  <label>Green threshold <span ng-bind-template="({{!vis.params.invertScale ? 'above':'below'}} this value will be green)"></span></label>
  <input type="number" ng-model="vis.params.greenThreshold" class="form-control"/>
</div>
<div class="form-group">
  <label>
    <input type="checkbox" ng-model="vis.params.invertScale">
    Invert scale
  </label>
</div>
内容很简单,就是通过 ng-model 设置绑定变量,跟之前 HTML 里的联动。
最后一步,看控制器 traffic_light_vis_controller.js:
define(function (require) {

  var module = require('ui/modules').get('kibana/traffic_light_vis', ['kibana']);

  module.controller('TrafficLightVisController', function ($scope, Private) {
    var tabifyAggResponse = Private(require('ui/agg_response/tabify/tabify'));

    var metrics = $scope.metrics = [];

    $scope.processTableGroups = function (tableGroups) {
      tableGroups.tables.forEach(function (table) {
        table.columns.forEach(function (column, i) {
          metrics.push({
            label: column.title,
            value: table.rows[0][i]
          });
        });
      });
    };

    $scope.$watch('esResponse', function (resp) {
      if (resp) {
        metrics.length = 0;
        $scope.processTableGroups(tabifyAggResponse($scope.vis, resp));
      }
    });
  });
});
要点在:
$scope.$watch('esResponse', function(resp){})监听整个页面的请求响应,在有新数据过来的时候更新页面效果;agg_response/tabify/tabify把响应结果转换成二维表格形式。
最后加上一段样式表,这里就不贴了,见:https://github.com/logzio/kibana-visualizations/blob/master/traffic_light_vis/traffic_light_vis.less。
本节介绍的示例,出自 logz.io 官方博客和对应的 github 开源项目。logz.io 是基于 Kibana4.1 写的插件。我这里修正成了基于最新 Kibana4.3 的实现。